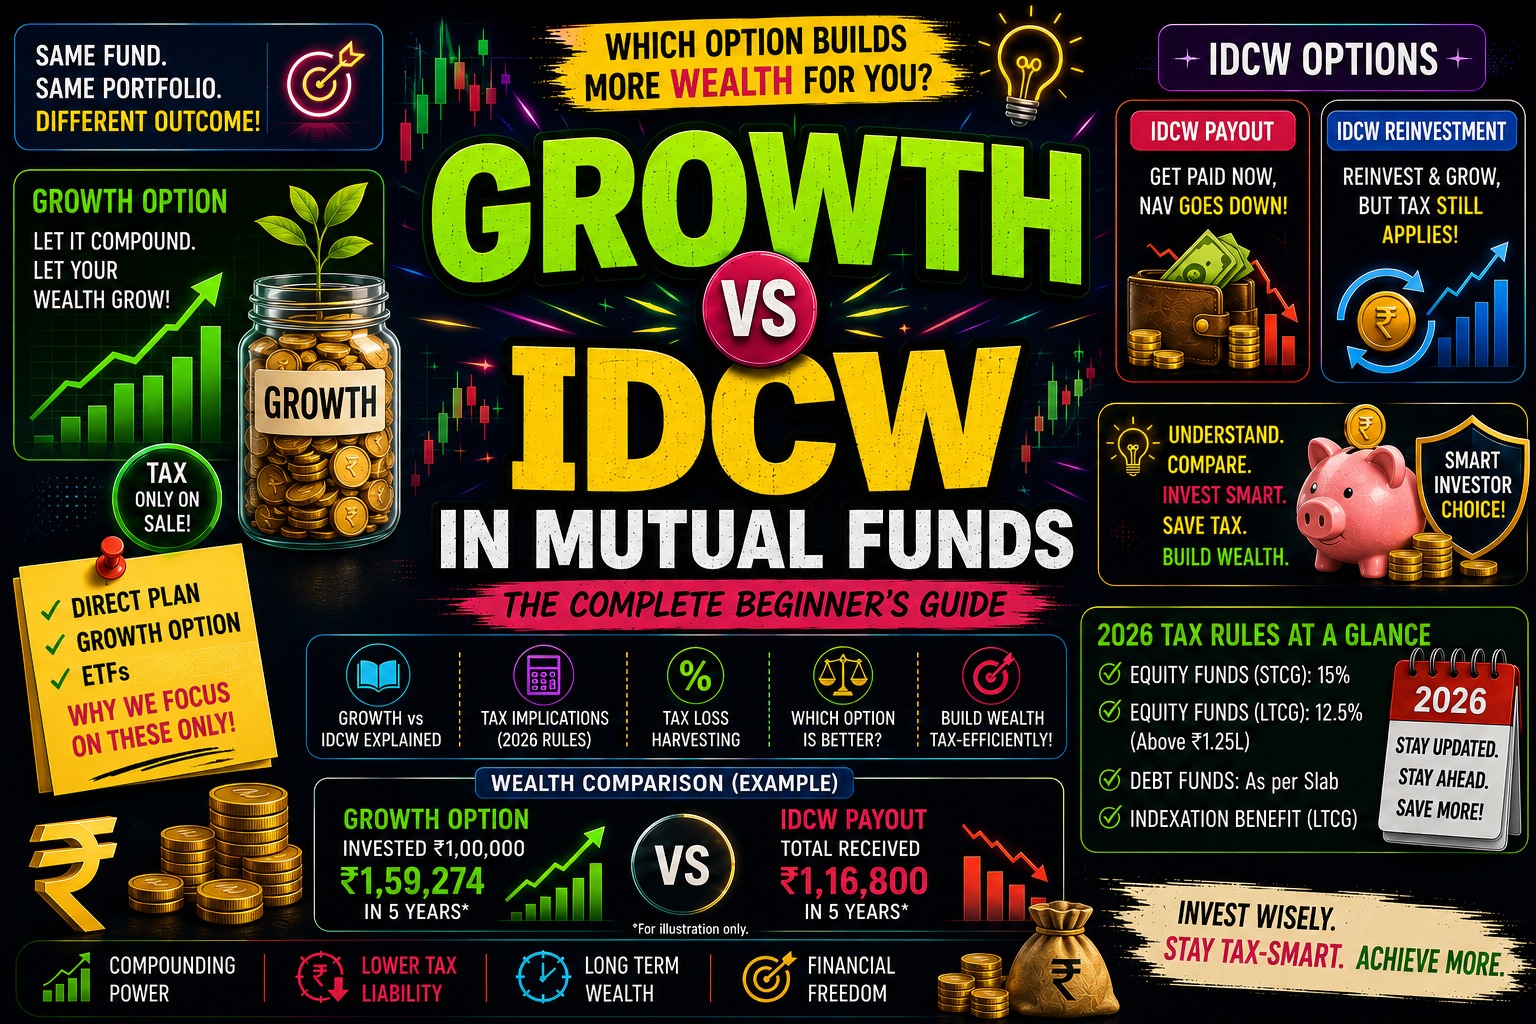
Growth vs IDCW in Mutual Funds: The Complete Beginner's Guide
Who this is for: Anyone who has ever opened a mutual fund app, seen options like "Direct Growth" or "Regular IDCW Payout", and immediately felt lost. This guide explains what every single one of those words means — and by the end, you will understand exactly why this website tracks and analyses only Direct plan funds and ETFs.
1. The Four-Word Confusion
When you search for a mutual fund to invest in — say, the Mirae Asset Large Cap Fund — you don't just find one fund. You find something like this:
Mirae Asset Large Cap Fund — Direct — Growth

Mirae Asset Large Cap Fund — Direct — IDCW Payout

Mirae Asset Large Cap Fund — Direct — IDCW Reinvestment

Mirae Asset Large Cap Fund — Regular — Growth

Mirae Asset Large Cap Fund — Regular — IDCW Payout

Mirae Asset Large Cap Fund — Regular — IDCW Reinvestment
Six options. Same fund manager. Same underlying stocks. But very different outcomes for your money. This is one of the first and most paralysing confusions that every new mutual fund investor faces.
Here's the good news: there are really only two axes of choice here, and once you understand them, the right answer becomes obvious for most people.
Axis 1: Plan Type — Direct or Regular This is about how you buy the fund and who gets paid in the process.
Axis 2: Option — Growth, IDCW Payout, or IDCW Reinvestment This is about what happens to the profits the fund earns.
This blog focuses primarily on the second axis — what Growth and IDCW really mean, how they work mechanically, and how dramatically different their tax and wealth outcomes are. At the end, we bring in the first axis (Direct vs Regular) to complete the picture, and explain exactly why this website's data and analysis covers only the Direct plan with the Growth option, plus ETFs.
2. Before We Begin: What Does a Mutual Fund Actually Do With Its Profits?
When a mutual fund invests your money in stocks or bonds, those underlying assets generate profits. A large-cap equity fund might earn:
- Capital gains from selling stocks that have gone up in price
- Dividend income from stocks in its portfolio that pay dividends
- Interest income from any bonds it holds
The fund now has a pot of money — call it a distributable surplus. The question is: what does it do with it?
This is exactly where Growth and IDCW diverge.
💡 Key Insight: Growth and IDCW are not different funds. They hold an identical portfolio of exactly the same stocks and bonds. The fund manager is the same. The investment strategy is the same. The only difference is what happens to the profits generated by that identical portfolio.
3. The Growth Option: Let It Compound
In the Growth option, the answer to "what do we do with the profits?" is simple: we keep it in the fund.
The profits aren't paid out to you. They stay inside the scheme and are reinvested — automatically, every day — into the same fund. This causes the NAV (Net Asset Value, i.e., the per-unit price of the fund) to keep rising over time.
If you invest in a Growth fund and check your portfolio after three years, the NAV you see will be noticeably higher than what it was when you bought in. Your units are worth more. You haven't received any payouts, but the value of your investment has grown, and that growth compounds on top of itself.
Worked Example 1: Growth Option
Priya invests ₹1,00,000 in the Growth option of a large-cap fund on 1 April 2023, when the NAV is ₹100. She gets 1,000 units.
Over the next two years, the fund delivers 15% annual returns. The fund earns dividends from stocks, books capital gains from selling positions — and every rupee of those profits stays in the fund.
By 1 April 2025, the NAV has grown to ₹132.25 (₹100 × 1.15 × 1.15).
Priya's 1,000 units are now worth ₹1,32,250.
She hasn't received a single rupee in payouts during those two years. But her money has been working silently — profits earning returns on profits, compounding uninterrupted.
The key character of Growth: All profits stay invested. NAV rises over time. You receive nothing until you sell. Tax is only triggered when you sell.
4. What is IDCW? (And Why Was It Called "Dividend" Before?)
IDCW stands for Income Distribution cum Capital Withdrawal. Until April 2021, this option was simply called the "dividend option." SEBI — the securities market regulator — mandated the name change, and the reason for that change is one of the most important things to understand in this entire blog.
Why the Old Name Was Misleading
When a company (say, Reliance Industries) pays a dividend, it's genuinely distributing profits from its business. The company earned money, and it's sharing a portion of those earnings with shareholders. Your share price typically stays around the same level; you get extra money on top.
When a mutual fund paid a "dividend" under the old system, something very different happened. The fund would take money out of the NAV and hand it to you. Your NAV would drop by exactly the amount of the payout. You weren't receiving money the fund had earned on top of your investment — you were receiving a piece of your own investment back.
This led to a widespread and costly misunderstanding. Many investors saw "dividend option" and thought they were getting bonus income, the way a stock's dividend feels like extra money. They weren't. They were getting their own money returned to them, now taxable as income.
SEBI's renaming to Income Distribution cum Capital Withdrawal was designed to make this explicit. The name literally says: this is a distribution that may include a withdrawal from your capital. It's not a bonus.
💡 The Dividend Illusion: The old "dividend option" name made investors feel like they were getting rewarded. The new IDCW name tells the truth — you're getting some of your own money back, and in the process, the NAV drops by the same amount.
5. IDCW Payout: How It Actually Works
In the IDCW Payout option, the fund periodically distributes money to you in cash — directly credited to your bank account. This happens whenever the fund has accumulated distributable surplus and the trustees approve a distribution.
The payout can be monthly, quarterly, half-yearly, or annually — depending on the scheme. But it's not guaranteed. SEBI rules require that a fund can only declare IDCW from distributable surplus. If the market has gone down, if the fund has realised losses, there may be no IDCW declared at all.
What Happens Mechanically
On the day the IDCW is declared, there is a concept of a record date (the date on which you must hold units to be eligible for the payout). On that date:
1. The fund calculates IDCW per unit (e.g., ₹5 per unit) 2. It multiplies by your units to get your payout 3. It pays you that amount (minus TDS if applicable) 4. The NAV drops by exactly ₹5 per unit
Worked Example 2: IDCW Payout
Vikram invests ₹1,00,000 in the IDCW Payout option of the same large-cap fund on 1 April 2023. NAV is ₹50. He gets 2,000 units.
After one year, the NAV has grown to ₹60 (reflecting the fund's returns). The fund declares an IDCW of ₹8 per unit.
What happens:
- Vikram receives: 2,000 × ₹8 = ₹16,000 in his bank account
- NAV after IDCW: ₹60 − ₹8 = ₹52
- Value of Vikram's remaining units: 2,000 × ₹52 = ₹1,04,000
- Total position: ₹1,04,000 (units) + ₹16,000 (cash) = ₹1,20,000
Now compare this to what Priya (from Example 1, same returns but Growth option) has:
- Value: ₹1,15,000 (from a different fund with different NAV, so not directly comparable by absolute value — but the economic position before tax is the same)
Wait — are they the same economically? Before tax, yes. The total value of your position (units + cash received) is arithmetically equivalent. The Growth investor has ₹1,20,000 sitting inside their units. The IDCW Payout investor has ₹1,04,000 in units and ₹16,000 in cash — same ₹1,20,000 in total.
But after tax? This is where they diverge dramatically. We'll cover this in Section 9.
💡 The key character of IDCW Payout: You get cash periodically. But the NAV drops by the exact same amount. You're not richer — you've just moved money from your investment into your bank account. The tax, however, is very real.
6. IDCW Reinvestment: The Middle Ground That Isn't
IDCW Reinvestment sounds like the best of both worlds: you get the "dividend" (IDCW) declared, but instead of getting cash, it's reinvested into the same fund. You get more units. Isn't that the same as Growth?
No. It is critically different. This is one of the most common misconceptions.
Here's exactly why.
In the Growth option, profits accumulate inside the fund. The NAV grows continuously. No taxable event occurs until you sell.
In the IDCW Reinvestment option, the sequence is: 1. Fund declares an IDCW of ₹X per unit 2. The NAV drops by ₹X per unit (this happens in both IDCW variants) 3. The ₹X is used to buy you more units at the now-lower NAV 4. But here's the catch: That ₹X of IDCW is a taxable event in the year it's declared — even though you never actually received the cash
The tax law treats the IDCW as "income received" regardless of whether you chose payout or reinvestment. You owe tax on that IDCW at your income tax slab rate, even though the money went straight back into the fund.
Worked Example 3: Growth vs IDCW Reinvestment (Side by Side)
Both Siddharth (Growth) and Meera (IDCW Reinvestment) invest ₹1,00,000 in the same fund at NAV ₹100 — getting 1,000 units each.
After Year 1, NAV has risen to ₹115. The fund declares an IDCW of ₹10 per unit.
| Siddharth (Growth) | Meera (IDCW Reinvestment) | |
|---|---|---|
| NAV after one year (pre-IDCW) | ₹115 | ₹115 |
| IDCW declared | Nil | ₹10/unit |
| IDCW amount | Nil | ₹10,000 |
| NAV after IDCW | ₹115 | ₹105 (115−10) |
| New units from reinvestment | 0 | 95.24 (10,000÷105) |
| Total units | 1,000 | 1,095.24 |
| Portfolio value | ₹1,15,000 | ₹1,15,000 |
| Tax payable (30% slab) | ₹0 (no redemption) | ₹3,000 (30% on ₹10,000) |
| After-tax net position | ₹1,15,000 | ₹1,12,000 |
The reinvestment doesn't protect you from the tax. It just means you pay tax and buy more units with what's left, instead of receiving cash and buying more units with what's left.
Over many years, this tax drag in IDCW Reinvestment compresses your reinvestment base relative to Growth — and the difference compounds into a significant gap.
⚠️ IDCW Reinvestment also creates a bookkeeping nightmare for capital gains. Each reinvestment creates a new "lot" of units with a fresh purchase date and a different NAV (the ex-IDCW NAV). When you eventually sell, your broker or CA has to track dozens of micro-lots, each with their own holding period and cost basis. With FIFO (first-in, first-out) rules, this can get extremely complex to compute accurately for ITR filing.
7. The NAV Illusion: Why High IDCW Yields Are a Trap
A common marketing pitch for IDCW funds is the "dividend yield" — something like "this fund paid ₹3 per unit in the last year, and the NAV is ₹30, so that's a 10% dividend yield!"
This reasoning is fundamentally flawed, and here's why.
Consider two investors who both started with ₹1,00,000 in the same fund at NAV ₹100. After five years, the Growth option NAV has reached ₹200 (12.5% CAGR). The IDCW option, meanwhile, has a NAV of ₹130 — because over those five years, ₹70 per unit has been paid out as IDCW across multiple distributions.
Now someone looks at the IDCW fund and sees:
- NAV: ₹130
- Last year's IDCW: ₹10 per unit
- "Dividend yield": 7.7%
And they think: "Wow, 7.7% yield! That's like a regular income stream."
But look at what's really happened. The Growth investor's ₹1,00,000 has become ₹2,00,000 (unrealised, untaxed). The IDCW investor received ₹70,000 in payouts over five years (each taxed at slab rate each year) and still holds units worth ₹1,30,000. Total gross position: ₹2,00,000. But after paying tax at 30% on each year's IDCW, they've paid roughly ₹21,000 in tax along the way. Net position: roughly ₹1,79,000.
The "yield" was never additional income. It was a metered return of the investor's own growing corpus — except each instalment was taxed the moment it was paid out.
💡 The NAV trap: A lower IDCW NAV doesn't mean the fund is cheaper or that you're getting a "higher yield on investment." It means profits have been paid out and taxed over time. Always compare the total wealth position (NAV × units + all cash received), not just the NAV or the yield in isolation.
8. The Big Comparison: Growth vs IDCW Payout vs IDCW Reinvestment
Here is a complete, consolidated comparison of all three options across every dimension that matters:
| Dimension | Growth | IDCW Payout | IDCW Reinvestment |
|---|---|---|---|
| Where do profits go? | Stay in fund, raise NAV | Paid to you in cash | Used to buy more units |
| Do you receive cash? | No | Yes, periodically | No |
| NAV over time | Rises steadily | Periodically reset lower | Periodically reset lower |
| Number of units you hold | Fixed (unless you buy more) | Fixed | Increases after each reinvestment |
| Total portfolio value | = Units × growing NAV | = Units × lower NAV + cash received | = More units × lower NAV |
| Compounding | Uninterrupted, full power | Interrupted at each payout | Interrupted by tax drag |
| When is tax triggered? | Only at redemption | At each IDCW declaration | At each IDCW declaration |
| Tax rate (equity fund) | 20% STCG or 12.5% LTCG | Slab rate (5-30%) | Slab rate (5-30%) |
| TDS applicable? | No | Yes, if IDCW > ₹10,000/year per AMC | Yes, if IDCW > ₹10,000/year per AMC |
| Complexity at ITR time | Simple (one set of capital gains) | Moderate (IDCW as other income) | High (multiple cost-basis lots) |
| You control timing of tax? | Yes — you choose when to sell | No — fund decides when to distribute | No — fund decides when to distribute |
| Best suited for | Long-term wealth creation | Income-seeking retirees (with caution) | Almost nobody — IDCW Reinvestment is dominated by Growth on every axis |
| Ideal time horizon | 5+ years | Short-term need for periodic cash | N/A |
9. The Tax Argument: Why Growth Wins for Most Investors
The tax difference between Growth and IDCW is not a minor detail. For anyone in the 20% or 30% tax bracket, it's the single most important reason to choose Growth.
The Growth Tax Story
With Growth, you pay tax exactly once: when you sell your units. The rate depends on the fund type and holding period.
For an equity fund (the most common case):
- Held ≤ 12 months: STCG at 20% (flat) + 4% cess
- Held > 12 months: LTCG at 12.5% on gains above ₹1.25 lakh per year, + 4% cess
Critically, you also get to choose when you sell. If markets are down, you can wait. If you have capital losses elsewhere, you can time the sale to offset them. If you're in a lower tax year (say, after retirement), you can redeem then instead of now.
The IDCW Tax Story
IDCW payouts — in both Payout and Reinvestment variants — are taxed as "Income from Other Sources" in the year they're declared. They're added to your total income and taxed at your slab rate: 5%, 10%, 15%, 20%, or 30%.
You have no control over the timing. The fund declares IDCW when it wants to (or when market conditions allow it). If you're in the 30% bracket and the fund declares ₹50,000 in IDCW in a good market year, you owe ₹15,000 in tax on that — whether or not you needed the money, whether or not you asked for it.
TDS on IDCW
From FY 2025-26, AMCs must deduct TDS at 10% on IDCW payouts if the total amount exceeds ₹10,000 per financial year per AMC for resident Indian investors (raised from the old ₹5,000 threshold). If you haven't submitted your PAN, the TDS rate jumps to 20%.
This TDS will show up in your Form 26AS. You'll need to declare the full IDCW amount as income in your ITR and claim the TDS as credit. If your slab rate is higher than 10%, you'll need to pay the balance tax. If your slab rate is lower (0% or 5%), you can claim a refund — but that refund requires filing and waiting.
A Number That Says It All
Rahul (30% tax bracket) and Suresh (also 30% bracket) both invest ₹5,00,000 in an equity fund that earns 12% CAGR over 10 years. Rahul chooses Growth. Suresh chooses IDCW Payout.
Assume the fund pays out approximately 4% per year as IDCW, compounding on an eroding base.
| Rahul (Growth) | Suresh (IDCW Payout) | |
|---|---|---|
| Investment | ₹5,00,000 | ₹5,00,000 |
| Gross corpus after 10 years | ₹15,53,000 | ₹15,53,000 (before tax drag) |
| IDCW received over 10 years | — | ~₹2,80,000 (cumulative) |
| Tax paid on IDCW at 30% | — | ~₹84,000 (paid yearly) |
| Remaining units value | ₹15,53,000 | ~₹12,73,000 |
| Tax at redemption (Rahul, LTCG 12.5%) | ₹1,28,500 (approx) | — |
| Final net wealth | ~₹14,24,500 | ~₹12,73,000 + ₹1,96,000 = ~₹14,69,000 |
Wait — in this simplified calculation Suresh actually comes out slightly ahead? Let's look more carefully: that's only possible if the IDCW tax was paid from the distributions themselves and Suresh was able to reinvest the after-tax IDCW proceeds externally at the same 12% rate. In practice, most IDCW investors don't reinvest with that discipline — they spend the payouts. And even if they do reinvest externally, the reinvestment is taxed again at redemption. The real-world gap is typically much larger in Rahul's favour.
Moreover, the 10-year scenario above assumes a fixed IDCW schedule. In equity funds, IDCW is highly irregular — declared in good years, skipped in bad years. In the years the fund skips IDCW, Suresh has no cash flow anyway, making the "regular income" argument hollow.
💡 The decisive factor: In a Growth fund, the government doesn't get its cut until you sell. Every rupee of return compounds for the full holding period. In an IDCW fund, the government takes its slice year by year — and that slice leaves less money compounding for you. Over 15-20 years, this difference is not marginal. AMFI data consistently shows Growth options outperforming their IDCW counterparts by 1.5–2.5% annually in equity funds over 10-year horizons.
10. The Compounding Argument: Why IDCW Breaks the Chain
The most powerful concept in investing is compound interest — earning returns on your returns. The Growth option is designed to maximise it. IDCW is designed to interrupt it.
Imagine a snowball rolling down a hill. Every rotation, the snowball picks up more snow and grows larger. Each rotation now has a bigger surface area to collect snow on. This is compounding — each year's returns are added to the base, creating a larger base for the next year's returns.
IDCW is like someone periodically cutting the snowball in half and handing you the removed snow. You get to hold the removed snow (the IDCW), but the snowball starts each round from a smaller base. The compounding isn't broken entirely — it just runs on a smaller base each time.
A ₹1,00,000 investment earning 12% annually:
| Year | Growth (NAV) | IDCW (NAV after 4%/yr payout) |
|---|---|---|
| 0 | ₹1,00,000 | ₹1,00,000 |
| 5 | ₹1,76,234 | ₹1,46,933 + ₹29,301 paid out* |
| 10 | ₹3,10,585 | ₹2,15,892 + ₹94,693 paid out* |
| 20 | ₹9,64,629 | ₹4,66,096 + ₹4,98,533 paid out* |
*Cumulative payouts, pre-tax. After tax at 30% slab, the "paid out" column shrinks significantly.
Notice that in the Growth column, the base for compounding in Year 11 is ₹3,10,585. In the IDCW column, the base is only ₹2,15,892 — 30% smaller — because profits have been periodically removed. The growth rate is the same. But the base is smaller, so Year 11 produces less in absolute terms.
Over 20 years, this difference is enormous even before accounting for the tax drag on the distributed amounts.
11. Who Should Choose IDCW? (The Narrow Case)
After everything above, is IDCW ever the right choice?
Yes — but for a very specific investor profile:
The case for IDCW Payout is strongest when all of these are true simultaneously:
1. You are in the 0% or 5% tax bracket. If you're a senior citizen or a retired person with total income well below the basic exemption limit, the "slab rate" on IDCW is zero or 5%. The tax disadvantage vs Growth largely disappears.
2. You genuinely need periodic cash flow and cannot otherwise manage regular withdrawals. You have no access to a Systematic Withdrawal Plan (SWP), you don't trust yourself to manually redeem for cash flow, and you have no other income source.
3. You are investing in a debt fund or a conservative fund where the growth difference is less dramatic. In equity funds, the volatility of IDCW (declared in good years, zero in bad years) makes it unreliable as a cash flow mechanism.
4. Your investment horizon is short (1-3 years). For short horizons, the compounding argument loses much of its force, and the periodic payout gives you liquidity without having to redeem.
⚠️ The better alternative to IDCW for regular income: For almost every use case where someone wants regular income from a mutual fund, a Systematic Withdrawal Plan (SWP) on a Growth option fund is mathematically superior. An SWP lets you redeem a fixed amount monthly from a Growth fund — giving you regular cash flow while the rest of the corpus stays compounding. The withdrawal is taxed as capital gains (not slab rate), and you control the timing and amount completely. IDCW gives neither of those advantages.
12. Direct Plan vs Regular Plan: The Other Axis
We've now spent ten sections on the Growth vs IDCW dimension. But there's a second, equally important choice baked into that six-option list: Direct vs Regular Plan.
Both hold the exact same portfolio. The same fund manager makes the same investment decisions. The same stocks are held. But the Total Expense Ratio (TER) — the annual fee deducted from the fund — is different, and that difference is critical.
What Is the Total Expense Ratio (TER)?
TER is the annual fee charged by the AMC (Asset Management Company) to manage the fund. It's expressed as a percentage of assets and is deducted from the NAV every single day, proportionally. When you see a fund's NAV on any given day, that NAV already reflects the TER deduction. You don't pay it separately — it's silently taken out before the NAV is published.
Why Regular Plans Cost More
Regular plans pay a distributor commission — a fee to the bank, broker, or financial advisor who sold you the fund. This commission (typically 0.5% to 1.5% per year) is embedded inside the TER. The AMC collects a higher TER from the fund, then pays the distributor their cut.
Direct plans have no distributor. You buy directly from the AMC or through a SEBI-registered direct platform. No distributor = no distributor commission = lower TER.
As of 2025, the TER difference between Direct and Regular plans of the same fund typically ranges from:
- 0.5% to 1.0% per year for equity funds
- 0.1% to 0.5% per year for debt funds
The Compounding Impact of 1%
One percent doesn't sound like much. Let's see what it means over time.
Imagine two investors, Anjali (Direct) and Brijesh (Regular), both investing ₹15,000 per month for 25 years. Same fund, same stocks, same fund manager — just different plans.
| Anjali (Direct, TER 0.75%) | Brijesh (Regular, TER 1.75%) | |
|---|---|---|
| Monthly SIP | ₹15,000 | ₹15,000 |
| Duration | 25 years | 25 years |
| Gross return assumption | 12% per year | 12% per year |
| Net return after TER | ~11.25% | ~10.25% |
| Final corpus | ~₹2.41 crore | ~₹2.06 crore |
| Difference | ₹35 lakh |
₹35 lakh is the cost Brijesh pays for a distributor who, in many cases, simply clicked "buy" on his behalf.
For larger investments or longer horizons, the numbers are even more stark. A ₹10 lakh lump sum at 8% for 30 years: ₹1 crore in Direct vs ₹76 lakh in Regular — a ₹24 lakh difference from a 1% TER gap.
AMFI data from 2013 to 2025 confirms this: across categories, Direct plans have consistently outperformed Regular plans by approximately their TER differential. Large-cap equity Direct plans averaged around 13.2% CAGR vs 12.1% in Regular over this period.
💡 The TER deduction is invisible and relentless. It is charged whether markets are up or down, whether you're making money or losing it, and it compounds silently against you every single day. The only way to eliminate it is to choose Direct.
13. Putting It Together: The Four-Way Grid
Now let's see how all four main combinations stack up:
| Combination | What Happens | Best For |
|---|---|---|
| Direct + Growth ✅ | Lowest costs. All profits compound uninterrupted. Tax only at redemption at capital gains rates. | Almost all investors with any wealth creation goal |
| Direct + IDCW Payout | Low costs. But profits paid out and taxed at slab rate each time. NAV resets lower. | Retirees in 0-5% tax bracket needing income, with no SWP option |
| Regular + Growth | Distributor commission silently deducted daily. Compounding works but on a smaller base than Direct. | Investors who genuinely need handholding and are willing to pay for it |
| Regular + IDCW Payout ❌ | Highest costs AND worst tax treatment. Distributor earns commission on a declining NAV pool. | Nobody who has understood how it works |
The verdict is almost universal: Direct + Growth is the optimal combination for long-term wealth creation for the vast majority of Indian investors.
14. ETFs: The Purest Form of This Philosophy
Exchange Traded Funds (ETFs) take the Direct + Growth logic to its ultimate conclusion.
ETFs are passively managed index funds that trade on the stock exchange like shares. They have no "option" to select (they are inherently in Growth mode — there is no IDCW for most ETFs), and they have no "plan" distinction (they are inherently Direct, since you buy them from the exchange directly without an AMC and without a distributor taking a commission).
The TER on ETFs is typically 0.05% to 0.20% per year — far lower than even the cheapest active Direct fund. This ultra-low cost, combined with the index tracking (where the underlying portfolio is simply the index, requiring minimal active management), makes ETFs the most cost-efficient investment vehicle available to retail investors in India.
Every rupee of their portfolio's gains stays in the fund and compounds. There's no distributor taking a clip. There's no fund manager style drift. The IDCW question doesn't arise. The Direct vs Regular question doesn't arise.
15. Why This Website Covers Only Direct Plan Funds and ETFs
This brings us to the point we've been building toward. Every time you look at fund data, analysis, or comparisons on this site — whether it's performance charts, expense ratio tables, or category breakdowns — you will notice we track only Direct plan Growth option funds and ETFs. Never Regular plans. Never IDCW variants.
Here is the complete, reasoned explanation:
Reason 1: Regular Plan Data Is Polluted
The NAV of a Regular plan includes a daily deduction for distributor commission. This means its NAV trajectory tells you two things mixed together: how well the fund manager is managing the portfolio, and how expensive the distribution channel is. These are inseparable in the return numbers.
If you compare a Regular plan's 5-year return with a Direct plan's 5-year return, you're not comparing fund managers or strategies — you're comparing costs. That comparison is not meaningful for evaluating the fund itself.
Direct plan data, by contrast, reflects the true performance of the underlying portfolio as managed by the fund manager. When we show you performance data, we want you to see what the fund actually earns — not what's left after a distributor takes their share.
Reason 2: IDCW NAVs Are Incomparable Across Time
An IDCW fund's NAV at any given point tells you almost nothing useful. A fund that started at ₹10 in 2010 might show an NAV of ₹45 in 2025 — but it has also paid out ₹60 per unit in IDCW over those 15 years. Another fund started at ₹10 and shows an NAV of ₹100 — but paid out ₹5 total. You cannot compare the ₹45 and ₹100 NAVs without knowing the full distribution history.
Growth NAVs are clean. They incorporate everything — every rupee of profit the fund ever made is already in the NAV. ₹10 in 2010 becoming ₹100 in 2025 means the fund 10x'd your money. Period. No asterisks about "excluding distributions."
Growth plan data makes clean, apples-to-apples comparisons possible. IDCW data does not.
Reason 3: The Analysis We Provide Is Most Actionable for the Majority
The evidence is clear: for any investor with a 5+ year horizon who is not in the zero-tax bracket, Direct + Growth is the optimal choice. Not marginally better — significantly better. When this website provides analysis on fund performance, sector rotation, portfolio construction, or any other metric, we are building analysis for the decision framework that actually serves long-term wealth creation.
Analysing IDCW variants would mean providing analysis for an inferior choice, one primarily relevant for a small subset of income-seeking investors who, in most cases, would be better served by an SWP on a Direct Growth fund anyway.
Reason 4: ETFs Are the Future of Efficient Investing
ETFs represent the convergence of everything this blog has argued for: zero distributor commission (they're inherently direct), zero IDCW complexity (they're inherently in growth mode for most schemes), rock-bottom TER, full transparency of portfolio, and intraday tradability.
As India's ETF ecosystem matures — with more sector ETFs, factor ETFs, international ETFs, and bond ETFs becoming available — they deserve serious, data-driven analysis. We provide that.
16. Quick Reference: Everything in One Place
The Three Options at a Glance
| Growth | IDCW Payout | IDCW Reinvest | |
|---|---|---|---|
| Cash received? | No | Yes | No |
| NAV drops on payout? | No | Yes | Yes |
| Tax trigger | At sale | At each distribution | At each distribution |
| Tax rate | CG rates (12.5%/20%) | Slab rate (up to 30%) | Slab rate (up to 30%) |
| Compounding | Full | Interrupted | Partially interrupted + tax drag |
| ITR complexity | Low | Medium | High |
| Good for | Most investors | Retired, 0-5% bracket | Almost nobody |
Key Rules to Remember
- Growth = let it compound. Tax only when you sell. At capital gains rates. You control the timing.
- IDCW = getting your own money back, taxed at slab rate. Not a bonus. Not "free income."
- IDCW Reinvestment = worst of all worlds. You pay slab-rate tax on "income" you never touched, and you create a bookkeeping nightmare.
- Direct plan = fund performance without distributor drag. Always.
- Regular plan = paying 0.5–1.5% per year for a middleman. Silently, daily, compounding against you.
- ETF = Direct + Growth + lowest possible TER. The cleanest form.
Numbers to Keep in Mind
- 0.5–1.5% — the TER gap between Direct and Regular plans
- ₹35 lakh — approximate lifetime cost of 1% TER gap on a ₹15,000/month SIP over 25 years
- 1.5–2.5% — the annual outperformance of Growth over IDCW in equity funds over 10-year horizons
- ₹10,000 — the TDS threshold for IDCW in FY 2025-26
- 30% — your potential slab rate tax on IDCW if you're in the highest bracket
Final Word: Taxes, Compounding, and Transparency
Mutual fund investing has a lot of noise: fund rankings, star ratings, year-to-date returns, benchmark beating. But underneath all of it, three forces determine the outcome of your long-term investment:
The underlying portfolio's performance — what the fund manager buys. The cost structure — what's deducted before you see a rupee of that performance. The tax efficiency — how much of your return the government takes, and when.
The Growth option, in a Direct plan, optimises all three levers available to the investor. The portfolio is the same regardless of which option you pick — that's the fund manager's job, not yours. But cost and tax efficiency? Those are entirely in your control, and they're chosen with a single click when you select "Direct Growth."
ETFs go even further — passively tracking an index at the lowest possible cost, with no distribution layer at all.
This website was built on the conviction that high-quality, comparable, useful analysis requires a clean foundation. Direct plan Growth data and ETF data provide that foundation. Everything else introduces distortions — from commission deductions that muddy performance comparisons to NAV discontinuities from IDCW payouts that make historical charts misleading.
When you see a fund analysed here, you're seeing the real thing. What the fund actually earns, at the cost the informed investor actually pays.
This blog is for educational purposes and reflects rules in force for FY 2025-26 (AY 2026-27). Tax laws are subject to change. This is not personalised investment or tax advice. Please consult a SEBI-registered investment adviser or a Chartered Accountant for advice specific to your situation.